

In 2019, the Clemson Center for Geospatial Technologies was designated an official Esri Development Center. Later in 2021, the program name changed to Esri Development Program and was awarded to the entire Clemson community.
This special recognition is only awarded to a small number of leading university entities across the world that have exemplary programs focused on educating students to design and develop innovative applications based upon the ArcGIS platform.
How does it impact Clemson students?
Through this recognition, students at Clemson using GIS for their research are allowed special access to Esri software for their projects, get additional training, and the possibility to attend the Esri Developer Summit in Palm Springs, California.
Additionally, students are encouraged to participate in the Annual Outstanding EDC Student of the Year award.
Student of the Year Award
The EDC Student of the Year is an annual award open to all Clemson students. The winner will be recognized as Student of the Year for outstanding achievements in development of innovative tools, applications or techniques using ArcGIS platform. Each year the winner will be awarded with a plaque, cash prize, and one Esri Developer Summit registration.
Eligibility
All undergraduate and graduate students at Clemson University in any discipline are eligible for the award. Students demonstrate innovative use of the ArcGIS platform in their application.
2025 Clemson Student of the Year: Andrew Barton

Andrew is a Master's student at Clemson University pursuing an M.S. in Economic Analytics and graduated with a bachelor's degree in Economics from the same university in May 2024. In his Master's program, he is doing research on the effectiveness of various financial incentives on the adoption of residential solar energy across the country.
His lifelong love for maps and introduction to GIS through the Clemson GIS Workshop Series sparked his interest in GIS. Now, he works as a GIS Intern at the Clemson Center for Geospatial Technologies (CCGT) and has ever since August 2023. Throughout the course of his internship, he has had the opportunity to work with his colleagues to run the GIS Workshop Series and contribute to a variety of projects for many organizations along with Clemson students and staff.
Pendleton is a small town located a few mile Southeast of Clemson University, in South Carolina. The town has a rich history and culture, especially within the African American community. Buildings of past and present have been a centerpiece of this community, serving as places of gathering, education, and worship.
The goal of the project, "Recreating Historic Pendleton Using GeoAI and ML", is to create a foundation for an immersive 2D and 3D experience that accurately depicts historic Pendleton while also bringing to life historic buildings that are relevant to the town's African American community. To do this, he utilizes GeoAI and Machine Learning techniques (tree detection deep learning package, building footprint extraction deep learning package, and 3D buildings solutions package) to extract information from a diverse set of data sources, including satellite imagery, drone data, and LiDAR point cloud. Furthermore, this project compares the effectiveness of different data and techniques for creating 3D models.

The GeoAI Tree Detection tool, using NAIP imagery, successfully identified tree point locations. When combined with digitized buildings and historical photographs, the resulting 2D map offered an immersive visualization experience.
For the 3D mapping process, Digital Surface Models (DSMs) were generated from drone LiDAR data collected by the Clemson Center for Geospatial Technologies. Building footprint polygons were extracted using a deep learning model, streamlining what would otherwise be a time-consuming manual digitization process. The Segment Roof Parts tool further refined the footprints by dividing them based on rooftop slopes using underlying elevation data, enabling the generation of more detailed roof forms. The solution includes a procedural fill rule that was applied to the symbology of the segmented building footprint layer.

Pendleton Map Tour (2D Map)

3D Models
This project demonstrated strong potential for using a procedural workflow to efficiently generate 3D building models across large areas. The methodology is highly scalable and can be further enhanced by integrating more realistic textures in CityEngine and training a model specialized in identifying structures typical of rural towns like Pendleton.
You can view more information about Andrew's project here: https://arcg.is/18bW9y1
2024 Clemson Student of the Year: Isaac Quaye

Isaac Quaye is a Masters student in the City and Regional Planning program at Clemson University. Growing up in an industrial community in Ghana, he has developed a passion for addressing environmental justice and advancing sustainable development. He is interested in geospatial analytics, data driven planning scenario, civic analytics, and 3D visualization. He uses mixed method approaches and geospatial technologies to decern community patterns and processes to direct policy. He asks questions like how spatial technologies and civic data help discover pattern and understanding complex issues to inform policy. His research work evolves around city planning, urban design, and urban mobility with a focus on environmental justice, sustainability, quality of life and hazard mitigation.
For the past year at Clemson, he has worked with Clemson Center for Geospatial Technologies on projects that, leverage ArcGIS Pro, ArcGIS online and Dashboard. He also served as Student Assistant at the worldwide Esri User Conference, 2023. He has worked with colleagues at Institute for Geospatial Understanding through an Integrated Discovery Environment, I-Guide Summer school at UCAR Boulder on Improving 3D Representation of River in Digital Elevation Model (DEM).
The recent project he passionately embarked on aims to address vulnerabilities that shape community identity and social resilience. Specifically, it focuses on assessing the risk for community-defined historic places facing imminent threats from sea level rise (SLR) in South Carolina. The looming specter of SLR poses a significant challenge to these cherished landmarks, underscoring both their vulnerability and resilience. Unlike recognized historic sites, which often possess ample resources and technical expertise for evaluation and mitigation, community historic places frequently lack the capacity to undertake such assessments. The uncertainties surrounding SLR, and its associated impacts place these resources at immediate risk, highlighting the urgent need for proactive measures.


This project purports to model sea level rise for community defined historic places in order to plan for mitigation measures. Three coastal historic districts in South Carolina were the focus of this project (Atanticville Historic District, Bluffton Historic District and Murrells Inlet). The project had two objectives: Firstly, to predict hydrological connectivity within three coastal communities using a hydro-conditioned digital elevation model (DEM), and secondly develop a coastal inundation model to assess areas within the three historic districts that would be impacted by projected sea level rise.
Using a hydro conditioned DEM and Arc Hydro toolbox Isaac was to generate potential flow channels. It was necessary to do this because local areas have distinctive flow directions and understanding these flow channels will provide a comprehensive understanding of how water will impact the historic district. He merged the artificially generated flow channels with coastlines to serve as potential water sources for further modelling.
Using the Hydro-conditioned DEM, the water sources, slope, and surface roughness of the area, coastal inundation was modelled using the bathtub approach. The bathtub approach specifies areas below a specific elevation that would be inundated based on projected Sea level rise at the local level. This model is a simplified coastal inundation that can be used in small communities and other similar applications to understand the impact of projected SLR in order to inform hazard mitigation planning.


You can check out Isaac's project here: https://arcg.is/1vnaHu
2023 Clemson Student of the Year: Madeleine Bolick

Madeleine Bolick is a Ph.D. candidate in the Forestry and Environmental Conservation department at Clemson University, specializing in Environmental Data Science.
Madeleine is a graduate teaching assistant for the GIS for Natural Resources course, where she teaches undergraduate and graduate students how to use ArcPro, ArcGIS Online, and other GIS tools for geospatial analysis. She received the ‘Outstanding Graduate Teaching Assistant Award’ to recognize her hard work and dedication to her GIS students for the 2022-2023 school year.
As part of her teaching, Madeleine developed an online module to introduce students to using UAVs in natural resource research, and the resulting publication was recognized by the Education Sciences journal as an ‘Editor’s Choice’ article.
Outside of teaching, Madeleine’s research focuses on using advanced geospatial techniques, remote sensing, LiDAR data, and machine learning to assess water resources and provide suggestions for better management techniques to protect waterways.
In Madeleine’s most recent project, she ties together machine learning, terrestrial LiDAR data, and 3D modeling to analyze the flood potential of the urban stream system, Hunnicutt Creek on Clemson University’s campus. Urban streams are unique ecosystems that are comprised of natural land cover elements like grass and tree cover but also a large portion of impervious surfaces and hardened stream channel structures like culverts. This means stream managers need more effective ways to analyze these ecosystems and understand the impacts of precipitation storm events.
This project includes four major components that together provide a new framework for assessing changes in water levels in urban stream environments.
-
Use machine learning to predict future changes in stream water levels based on precipitation events.
-
Create 3D models from terrestrial LiDAR data to illustrate changes in water level in the stream channel.
-
Calculate changes in upstream water volume as a result of storm events and changes in water level.
-
Determine what areas of the watershed are prone to flooding during storm events and what areas remain dry.

First, using the time-series machine algorithm, Prophet, Madeleine was able to use surrounding air temperature, stream water temperature, precipitation, and relative humidity, to predict future water levels at four different water level sensor locations along the North Branch of Hunnicutt Creek. These future predictions can be used as an early detection system to understand when to expect large changes in Hunnicutt’s water level at the sensor locations.
While using machine learning provides these useful predictions, the numbers alone can be difficult for stream managers to understand what they mean in the context of the ecosystem. Therefore, Madeleine translated these future predictions of changes in water level into visual representations of what these changes would look like at each sensor location and what the corresponding change in water volume in the channel would be.

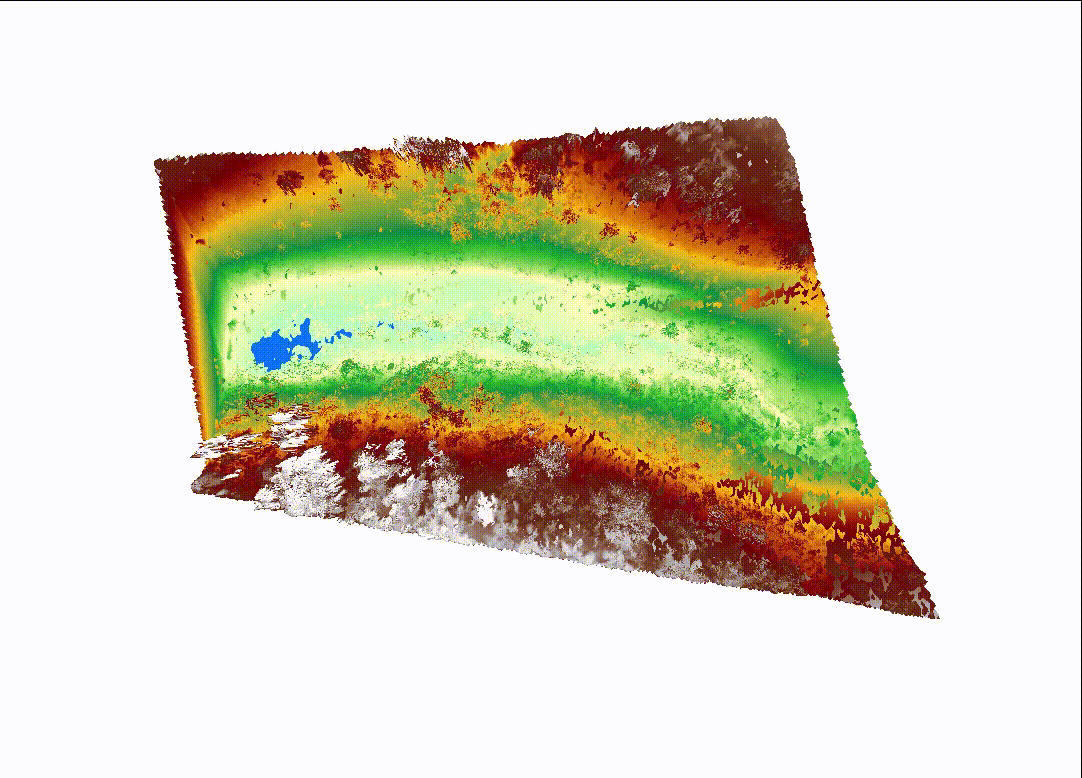
Madeleine used LiDAR collected from a terrestrial backpack unit, with the help of the Clemson Geospatial Center, to create 3D digital elevation models and digital surface models of the sections of North Hunnicutt Creek at the water sensor locations. These 3D models were then used to both visualize changes in water level and to calculate the change in water volume at these locations.
For example, at site 296, a change in water level of 0.25 meters, a frequent occurrence at this site during storm events, results in an increase of 34.9 m3 of water in the upstream channel. The animation to the left illustrates this change in water level and shows what areas of the watershed store water during rises in water level, and what areas remain dry.
This methodology for analyzing changes in water level in Hunnicutt Creek can be used by stream managers and stormwater managers to better understand the flood-prone areas on Clemson’s campus. In addition, the data can be used by riparian ecosystem scientists to analyze what areas of the watershed are at the highest risk for erosion, sedimentation, and potential loss of stream bank areas.
You can view more information about Madeleine’s project here: https://storymaps.arcgis.com/stories/ff2444e37dfb4e2a836fcf3e88b84932
2022 Clemson Student of the Year: Maziar Fooladi Mahani

Maziar Fooladi Mahani is a Ph.D. student in Mechanical Engineering at Clemson and a graduate research assistant with the Clemson Center for Geospatial Technologies. For the past two years, he has worked with the Clemson Center for Geospatial Technologies on a variety of projects, from drone applications to innovative LiDAR research and advanced field data collection.
One of his most innovative projects was done in collaboration with an international manufacturing company looking at improving their current calculations of carbon emissions for international freights.
Freight transportation currently makes up about 8% of global greenhouse gas emissions, and it is projected that its carbon emissions may double by 2050.
It is essential for manufacturing companies to have accurate estimates of their carbon emissions so they are able to analyze their current distribution and biggest contributors.
With a better understanding of their carbon emissions, companies will be able to reduce freight’s carbon footprint by focusing on the type of vehicles and routes that have an outsized impact on carbon emissions.
They will also be able to meet and demonstrate they are in compliance with new mandates on reducing net greenhouse gas emissions imposed by governments and international agencies.

The project had three main components:
- First, compare routing estimates from three service providers, Esri, Google Maps API, and MapQuest, to see which one hindered best results.
- Second, automate the calculation of carbon emissions using an ArcGIS Python notebook that would integrate the results from the routing calculations with freight emissions factors.
- Third, integrate the data published to ArcGIS Online with Power BI Server so the company can easily visualize and periodically run reports that will allow them to filter, compare, and analyze the data geographically and over time.
To this end, about two thousand freight records from three continents were analyzed to find traveled distance and time for each shipment. The records consisted of origin and destination addresses, transportation modes (i.e. air, ground, and sea), average payload, maximum payload capacity.

The routing analysis was performed using three routing service providers, ESRI, Google, and MapQuest to compare their implementation and performance. As shown in the table below, ESRI outperformed their routing competitors.

After calculating the distance for each shipping route using ESRI network analysis, Maziar developed an ArcGIS Python Notebook to automate the calculation of emissions based on transportation modes and payload information. It was able to calculate the emissions for every truck size, from small vans to heavy goods vehicles, and for every engine type, from diesel to petrol, to electric, across all ground routes.
Finally, Maziar designed a dashboard in Power BI to provide a big-picture visualization that empowered smart decision-making. The integration ArcGIS and Power BI helped to uncover patterns that are difficult to see in charts, tables, and spreadsheets.
Feeding emission analysis into smart maps, provided insights for adjustments that would optimize fleet performance and so reduce carbon emissions, for instance it was possible to identify which shipments contributed more to the overall pollution. With his analysis better logistical and routing decisions could be made, cutting the overall travel time, reducing fuel costs, and so reducing pollution.

2021 Clemson Student of the Year: Jacob Arnold

Jacob Arnold is a Ph. D candidate in Environmental Engineering at Clemson University. His research revolves around sustainability and resilient infrastructure systems, studied through holistic modeling to determine vulnerabilities and avoidable environmental impacts.
His main research project is specifically focused on the impact of the coal transportation industry and the infrastructure it relies on. More specifically, his analysis aims to demonstrate the alternative problems associated with coal transportation.
Through incorporating multiple network line datasets, ArcGIS Pro routing, and empirical data on coal transactions and emissions, GIS models of how coal flows through the US as well as the associated emissions have been developed.
Below is an overview of his project, from the manual data gathering phase that leads into automation made possible with ArcGIS Python notebooks. Each feedback loop indicates at least one scenario where tool output informed on changes necessary for steps and data managed earlier in the workflow.
The foundation for such an ambitious model is constructed from national-scale data on two important aspects of the coal transportation network: nodes and connecting lines.
Nodes consist of the origin points of every US coal mine active during the study period of 2008 to 2018 as well as the destination points of US coal-burning power plants, likewise active during the same time span.
The lines which connect these nodes together represent the three major modes of transportation available to coal in the US: railroads for freight trains, highways for freight trucks, and waterways (rivers and ocean routes) for barges.
Finally, to facilitate a multimodal connection between each of these three networks, another set of nodes is implemented to represent various transition terminals, such as barge-loading stations next to railroads.


Across each of these maps, this model demonstrates the double-edged sword that is the US coal industry.
Focusing on the high-traffic areas through Nebraskan railroads, combined with the fact that coal is still a major component of the US fuel mix, high vulnerabilities are a detriment to the resilience of the national energy infrastructure.
While fortification is normally recommended in these scenarios, this model also demonstrates the resulting greenhouse gas emissions of coal in these high traffic areas and beyond.
You can check out Jacob's project here: https://arcg.is/0va8zu0
2020 Clemson Student of the Year: Abi Roberts

Abi is a senior environmental engineering student at Clemson University. For the past year, she worked with the Clemson Center for Geospatial Technologies on a variety of projects, including creating web mapping applications and building dashboards with WebApp Builder for ArcGIS.
One of her main projects involved a collaboration with Greenville City Police Department and their Strategic Planning and Analysis Division. The goal of this project was the use of geospatial data analytics to increase their efficiency in resource allocation using big data. In particular, the Division was interested in better understanding the distribution and frequency of operations.
In order to achieve this, over 3 million records of their patrol vehicles' positional data were analyzed over space and time. To determine if a particular police car was stationary or moving, Abi created her own Python scripts in ArcGIS Pro that computed the difference in time and space between each two consecutive GPS locations for each patrol vehicle, as well as the frequency of places visited by the time of day and day of the month.
She then created a dashboard that answered specific questions such as which streets were most frequented, for how long, and the time of day visits occurred.
In order to create this dashboard, she used HTML and CSS to customize the information efficiently and appealingly.
The Police Department Strategic Planning Division were able to visualize and analyze the geographic distribution of their fleet, the frequency of places visited and the reliability of their new tracking system.

2019 Clemson Student of the Year: Justin Dowd

Justin is a senior in Clemson University’s School of Computing as well as a Senior Intern in the Clemson Center for Geospatial Technologies.
He has been been working with researchers in the Department of Environmental Engineering and Earth Sciences who are exploring the potential for rooftop solar photovoltaic (PV) deployment in South Carolina. The project aims to identify suitable locations for rooftop solar across the state using remotely sensed imagery (e.g. aerial and/or satellite imagery) and machine learning coupled with CyberGIS.
An initial assessment of Clemson's main campus has already been conducted, which identified a number of high-value locations. Justin is expanding on that analysis using known building footprints on campus and other training data to conduct supervised image classification to identify and calculate suitable rooftop area across the entire state of South Carolina.
Justin has developed and tested workflows for parallel computation to scale the analysis from the small test region to the entire state while exploring several GIS platforms: Esri ArcGIS Pro, GRASS GIS, and Google Earth Engine. Using a variety of imagery and additional data sets, he is testing each of these platforms to:
-
Evaluate the accuracy of the machine learning algorithm implementations
-
Identify the best combination of input data for most accurate rooftop identification
-
Determine the most efficient method of scaling the computation on each platform
The imagery data are the United States Department of Agriculture National Agriculture Imagery Program (NAIP) 1-meter resolution data, both a 3-band true-color image from 2017 and a 3-band multispectral image from 2009, the most recent year available for the area.
Justin is incorporating 1-meter resolution elevation data derived from the South Carolina Department of Natural Resource’s LiDAR database, where possible, to improve the classification accuracy, although this is not supported in GRASS GIS.
The Support Vector Machine (SVM) algorithm is utilized in ArcGIS Pro and Google Earth Engine, whereas the Maximum Likelihood algorithm is used in GRASS GIS as the SVM method is not implemented in the base software package.
The results presented in the table below show the percentage of buildings on Clemson University’s main campus correctly classified in each platform and with different combinations of imagery and elevation data. The classification accuracy is only considered for buildings present in all input data sets to remove the impact of construction and demolition over time.
Justin is discovering that each platform offers its own advantages and challenges. Google Earth Engine scales automatically without any change in workflow, though it is limited by the computational resources allocated to the free accounts. ArcGIS Pro gives the highest overall accuracy but is limited by the computing resources of a desktop computer. It does not operate natively in a Unix environment typical of high performance computing (HPC) clusters and has many limitations which reduce potential efficiency in a high throughput computing environment. GRASS GIS is producing the lowest overall accuracy, but runs on UNIX systems, meaning the workflow can be parallelized and scaled efficiently on an HPC cluster, such as Clemson University’s Palmetto Cluster.
Justin will continue to work on this project through and hopes to incorporate deep learning methods to improve the classification results. Other projects he has worked on at the Center for Geospatial Technologies include writing scripts to deploy Structure from Motion (SfM) software in parallel on the Palmetto Cluster to efficiently process photos from UAVs into a variety of geospatial data.

