Projects
The Clemson Center for Geospatial Technologies is here to provide GIS project support to students, faculty, and staff of Clemson University. Please contact Elham Masoomkhah, GIS Manager, to set up an appointment to discuss your project needs.
Below are some of the most recent projects at Clemson University that highlight the broad range of disciplines and techniques happening at our University using the latest GIS tools. If you have a project that you would like us to showcase, please contact us.
Crowd Sourced Tools to Map Hurricane Damage in Dominica
Hurricane Maria hit the island nation of Dominica at approximately 9:15pm on September 18, 2017. The storm devastated the island, destroying most buildings and leaving the population without power or communications for several days. The initial source of information about the disaster came from ham radio operators and aerial assessments. After several days this information was followed by news reports, and eventually direct communications between family members as local hotspots of power and internet service were restored in a few locations. Given the lack of information available immediately after the hurricane, CCGT generated this crowd sourced map to help collect and disseminate local information as the situation unfolded. Many people contributed to the data on the map by sharing personal knowledge of the situation and by scouring social and news media for evidence to document the evolving conditions. The map was used by many others to understand what happened on the island, to organize relief efforts, and even to help NASA to perform an initial validation of satellite-based damage proxy maps. CCGT is grateful to all of those, including many Clemson students, who helped with this effort to aid the people of Dominica.
- Clemson Center for Geospatial Technologies (CCGT)
Building Legacy Story Map
This collaborative effort among Clemson University Libraries, Special Collections and Archives, Library Technology Technical Services and Collection Management - Metadata and Monographic Resources Team, and Clemson Center for Geospatial Technologies helps us understand the campus’ historic buildings a little better, see them as they appeared through the years, learn unique facts about how they were built and used, and get to know the people whose names they carry. Our intern, Providence Adu has created a story map in which users can overlap the previous facades of the buildings on their current ones, and see the changes.
- Clemson Center for Geospatial Technologies (CCGT)
2D & 3D Accessibility Map of Cooper - Libraries
CCGT has created a multi-faceted exploration of geography as a factor in the 2016 presidential election. Our goal is to visualize spatial patterns in variables which may be important to the presidential campaigns, such as tweets about each candidate, campaign travel stops, and where candidates have established field offices.
We have examined how these factors may be influenced by geographic variables, such as the number of electoral votes in each state, the locations of swing states, and where each party has the strongest base.
- Clemson Center for Geospatial Technologies (CCGT)
Geography of the 2016 Presidential Election
CCGT has created a multi-faceted exploration of geography as a factor in the 2016 presidential election. Our goal is to visualize spatial patterns in variables which may be important to the presidential campaigns, such as tweets about each candidate, campaign travel stops, and where candidates have established field offices.
We have examined how these factors may be influenced by geographic variables, such as the number of electoral votes in each state, the locations of swing states, and where each party has the strongest base.
- Clemson Center for Geospatial Technologies (CCGT)
Mapping Tigertown
This project strives to create a functional, intuitive, and interactive map of Clemson University made available to everyone at Clemson to use for their own projects. We hope to create a useful product for students, staff, administrative services, and researchers by including thematic layers, such as buildings, streets, parking lots, restaurants, and trees, each represented in the basemap using an appealing representation. CCGT will use this project as an opportunity to showcase the latest trends in geospatial technologies to the Clemson community.
- Clemson Center for Geospatial Technologies (CCGT)
Planning for Tomorrow's Climate
Two of our CCGT interns investigated where changes in earth’s climate will most affect society and published an interactive story map as part of the Esri Global Content Challenge. The story map uses a combination of 2D and 3D maps and a cascading-style web app to show population, migration, and climate variables as a way to identify the most at-risk populations.
- Jonathan O'Brien and Amanda Farthing
Clemson Center for Geospatial Technologies (CCGT)
Comparing Scientific Progress with Maternal and Child Health Indicators Around the Globe
The goal of this project was two-fold. The first was to examine the distribution of total number of excerpts, the total number of scientific and technical journals, and key maternal and child health indicators. The second was to determine if there is a correlation between the scientific progress indicators and the maternal and child health indicators.
- Brenna Leahey and Joe Cahill
Appalachian Landscape Conservation Design
One of CCGT’s mission is to support faculty’s research and collaborations through the development of flexible GIS infrastructure and powerful web applications. As a recent example, Dr. Paul Leonard who works in the School of Agricultural, Forest, and Environmental Sciences department collaborated with Appalachian LCC (Landscape Conservation Cooperative) on a project that facilitated conservation planning at a large spatial and temporal scale. In order to do this, CCGT developed an integrated platform that allowed users to query conversation features in an interactive environment.
- Dr. Paul Leonard and Patrick Claflin
School of Agricultural, Forest, and Environmental Sciences and CCGT
Assessing State Action on the Right to Benefit from Scientific Progress
The purpose of this project was to explore, via Geographic Imaging Systems (GIS) data analysis, relations between states' commitment to the advancement of science and public health indicators.
They completed this project in conjunction with 2 AAAS fellows, Dr. Natasha Sianko and Dr. Jessica Wyndham, who are presenting data on Article 15 of the International Covenant on Economic, Social and Cultural Rights (ICESCR) to the United Nations (UN). Quality of life indicators used for this review include data on child mortality rate, percent access to clean water, percent population with sanitation facilities, and life expectancy for countries that reported Article 15 excerpts.
- Jenna Pollock and Hunter Lee
Reversing the Flow: studies in river development
A story map which covers four case-studies of development projects, examining their benefits and costs, both explicit and subtle, focusing more on the latter. It is an exploration of the absurd landscape. You’ll explore an aquatic ghost town on the Nebraska plains, witness a college town transform into a lakeside resort, watch an estuary turn to desert, and dive into a Himalayan Atlantis. More than a study in itself, the intent of this exploration is to ask questions. What costs, present and future alike, are we accounting for in these decisions? How do we value of a vanished culture? Where lays the worth of a lost city?
- Will Rice
Environmental and Natural Resource Economics and Policy
A Story Map: The Seven Natural Wonders of Clemson University
This study is dedicated to showing the seven natural wonders of Clemson's campus, while discovering the past. Ranging from the popular Death Valley to The Seneca River Bottoms, these areas show what's so grand about our campus, and why Clemson University is a beautiful place to be.
GIS was used to add historical meaning and signifiance to seven sites on the Clemson University campus.
- Dr. Lance Howard
History Creative Inquiry Class
Contributing Factors to Chronic Conditions in South Carolina, North Carolina, and Georgia
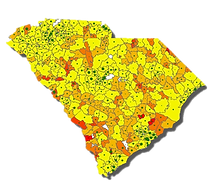
The main goal of this research project was to identify any relationships between three common chronic conditions: heart disease, hypertension, and diabetes. These were analyzed based on rates and prevalence. Potential factors that contribute to these conditions, including race and socioeconomic factors, will be analyzed to determine relationships to identify the counties in the most need of intervention(s). GIS was the most efficient way to potentially identify spatial relationships and share them with others in the healthcare field to better serve the community.

Biology and Management of the Hemlock Woolly Adelgid
The hemlock woolly adelgid is a forest pest causing widespread mortality of the eastern and Carolina hemlock trees in the eastern United States. It was accidentally introduced from Japan in the early 1950s near Richmond, VA and is now dispersed through a considerable portion of the eastern hemlock range and the entire range of Carolina hemlock. Dr. Joseph Culin and researchers in the College of Agriculture, Forestry, and Life Sciences are publishing an overview article for the Journal of Integrated Pest Management of the adelgid biology and the strategies employed to minimize the spread and impact of this pest. CCGT created maps of the infestation over time as well as maps of where predators were released as a strategy to manage this pest.
- Dr. Joe Culin and Blake Lytle
College of Agriculture, Forestry and Life Sciences and CCGT
Confessions of Clay: A Story Map about the Origins of Clemson
A Clemson Creative Inquiry Class, named Bringing Other Clemsons to Light, worked with our GIS team to create a visually appealing presentation based around the history and geography of Clemson University’s campus. Titled Confessions of Clay, this project used our workshops and expertise to find historical data and develop a web application through ArcGIS Online that can seamlessly display all of the relevant information. This presentation was put on display at a major conference in Indiana.
- Dr. Lance Howard
History Creative Inquiry Class
We at CCGT invite you, our fellow students, faculty, and staff, to tell us your favorite place in Clemson Country and see what places have true Clemson "paw prints!" Participate in our crowdsourced mapping project using the online form to add your entry. Show us your top spot around town and tell us about why you think it's the best.
We introduced this project during our GIS Day 2015 cevents, and we want to continue mapping our TIger Spirit!
-Clemson Center for Geospatial Technologies (CCGT)
Analyzing Food Insecurity in Upstate South Carolina
Food insecurity, defined by the USDA as “consistent access to adequate food (is) limited by a lack of money and other resources at times during the year,” is the most broadly-used measure of food deprivation in the United States. Our goal for this project is to analyze food security in the upstate region of South Carolina and find at-risk locations by considering existing resources, accessibility, and socioeconomic factors. Our study examines the probable factors that cause food insecurity in those areas: Is it due to low income levels, transportation methods, lack of access or a combination of these factors?
- Kayla Hines and Palak Matta
Geographic Analysis of Health Care Facility Demand in Upstate South Carolina
This project is designed to aid health care administrators in site-selection for a rural health clinic that would serve the sparsely populated areas of upstate South Carolina. This geospatial analysis will be focused on pinpointing appropriate locations for a new health clinic in the South Carolina Upstate by providing a web app comparing various factors that influence health disparities in rural areas.
- Julianne McLeod and Hunter Flanagan

Using GIS to Conduct a Household Survey for Developing a Community Health and Assets Assessment in the Dominican Republic
Team-based creative inquiry research was conducted in the Dominican Republic (DR). Clemson students worked with Dominican students to conduct a Community Health Assessment (CHA) in Las Malvinas. Five local health priorities (sanitation, education, chronic disease, vaccine preventable diseases, and unwanted pregnancies), and five sectors (community at large, school, healthcare, community organizations, and work) were used to frame this study. ArcGIS survey system was used to collect household-based data. The preliminary GIS data analysis allowed to visualize selected risk factors and related outcomes in Las Malvinas.
- Dr. Arelis Moore de Peralta
Youth, Family and Community Studies Creative Inquiry Class
The Topography of Diabetes in the Carolinas
The Center for Disease Control has reported that more than 29 million people have diabetes in the United States; that is 9.3% of the total population. Even more concerning, an estimated 1 in 4 people with diabetes do not know it. Without proper care, diabetes can lead to a litany of complications including cardiovascular disease, stroke, kidney failure, loss of vision, amputation of toes, feet or legs, and premature death.The goal of our project is to examine the spatial distribution of diabetes in the Carolinas, as well as the spatial relationship between diabetes and a number of environmental, demographic, socioeconomic, and health-related factors.
-Danielle Mauro and Ben Martin
Evaluation of Socio-economic and Environmental Factors Associated with Lung Cancer in South Carolina
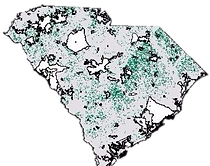
In South Carolina, lung cancer is the second most fatal disease after heart disease, and over 9,000 die each year. In this project, we study spatial relations between lung cancer rates and some of its contributing factors to evaluate the dominating socio-economic factors associated with lung cancer.
For instance, SC hosts the biggest tire (i.e. rubber) industry in USA, so the relationship between the rubber industry sites and the lung cancer incidence rates in SC is investigated using a GIS based approach.
- Abdullah Al Mamun and David Beasley

Socio-environmental potential for Solar Energy in South Carolina
The purpose of this study was to determine optimal locations for implementation of utility-scale solar in South Carolina and the resulting geographical potential of solar on those lands. By excluding areas where large solar projects would be physically, socially, or environmentally undesirable, the theoretically extractable solar energy was calculated using Global Horizontal Irradiance data for the state.
A GIS-based suitability model was used for this analysis, considering limitations imposed by land use, land type, protected areas, slope, and aspect.
- Amanda Farthing
Industrial Engineering

Assessment of Place Attachment in Downtown Savannah,Georgia
The purpose of this study was to assess resident’s levels of place attachment to places and elements throughout Savannah, GA. Participants photographed places in Savannah, recording the photo location, time taken, and reason for taking the photo.
ArcGIS was utilized to conduct an analysis of the photos based on spatial and geographical relationships including mapping analysis of the data.
- Courtney Grunninger Bonney
Planning, Design, and the Built Environment PhD Program
Spatial Distribution of Nutrition Risk for Elderly Population in South Carolina

The purpose of this study was to show areas in South Carolina where the adult population age 65 and older scored high on the nutrition risk index, showing that they were at risk of many adverse effects brought on by malnutrition. These areas were then compared to the level of involvement by area in the state-wide health initiative that this study was in response to.
- Maciel Ugalde
Food Nutrition and Packaging Sciences

Spatial Distribution of Archaeological
Artifacts in Casma, Peru
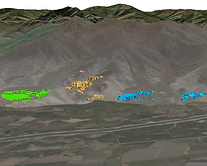
The purpose of this study was to show the spatial distribution of ruins comprising the different sectors of the El Purgatorio archaeological site in Casma, Peru, along with the differences in the frequency of certain artifacts between sectors. It was found that Sector B (shown in yellow) contained an unusually large amount of batanes, or grinding stones. It is suspected that this may have been the ancient equivalent of a brewery.
- Jonathan O’Brien
School of Business and Behavioral Science
Social Media and Real Time Disaster Tracking
The vast amount of daily geolocated data generated by Twitter makes it an effective source of information for dealing with natural disasters such as floods, hurricanes, tornadoes, or earthquakes. Using big data analytics, we can uncover hidden patterns, unknown correlations, and other useful information that combines that information with sensors and engineering instruments to provide a unique edge in detecting and tracking natural disasters in real-time.
The ArcGIS GeoEvent service provides a common platform for merging these two sources of data. Through it, we are able to analyze and manipulate the data while being able to display the information onto a webmap, without delay, to provide a constant feed to the general public of major events occurring near them keeping them constantly aware and safe.
- Jean El Melki and Irfan Tak
Civil Engineering and CITI


